Step-by-Step Guide to Creating & Analyzing Cohorts
-
Log in to your OptCulture workspace.
-
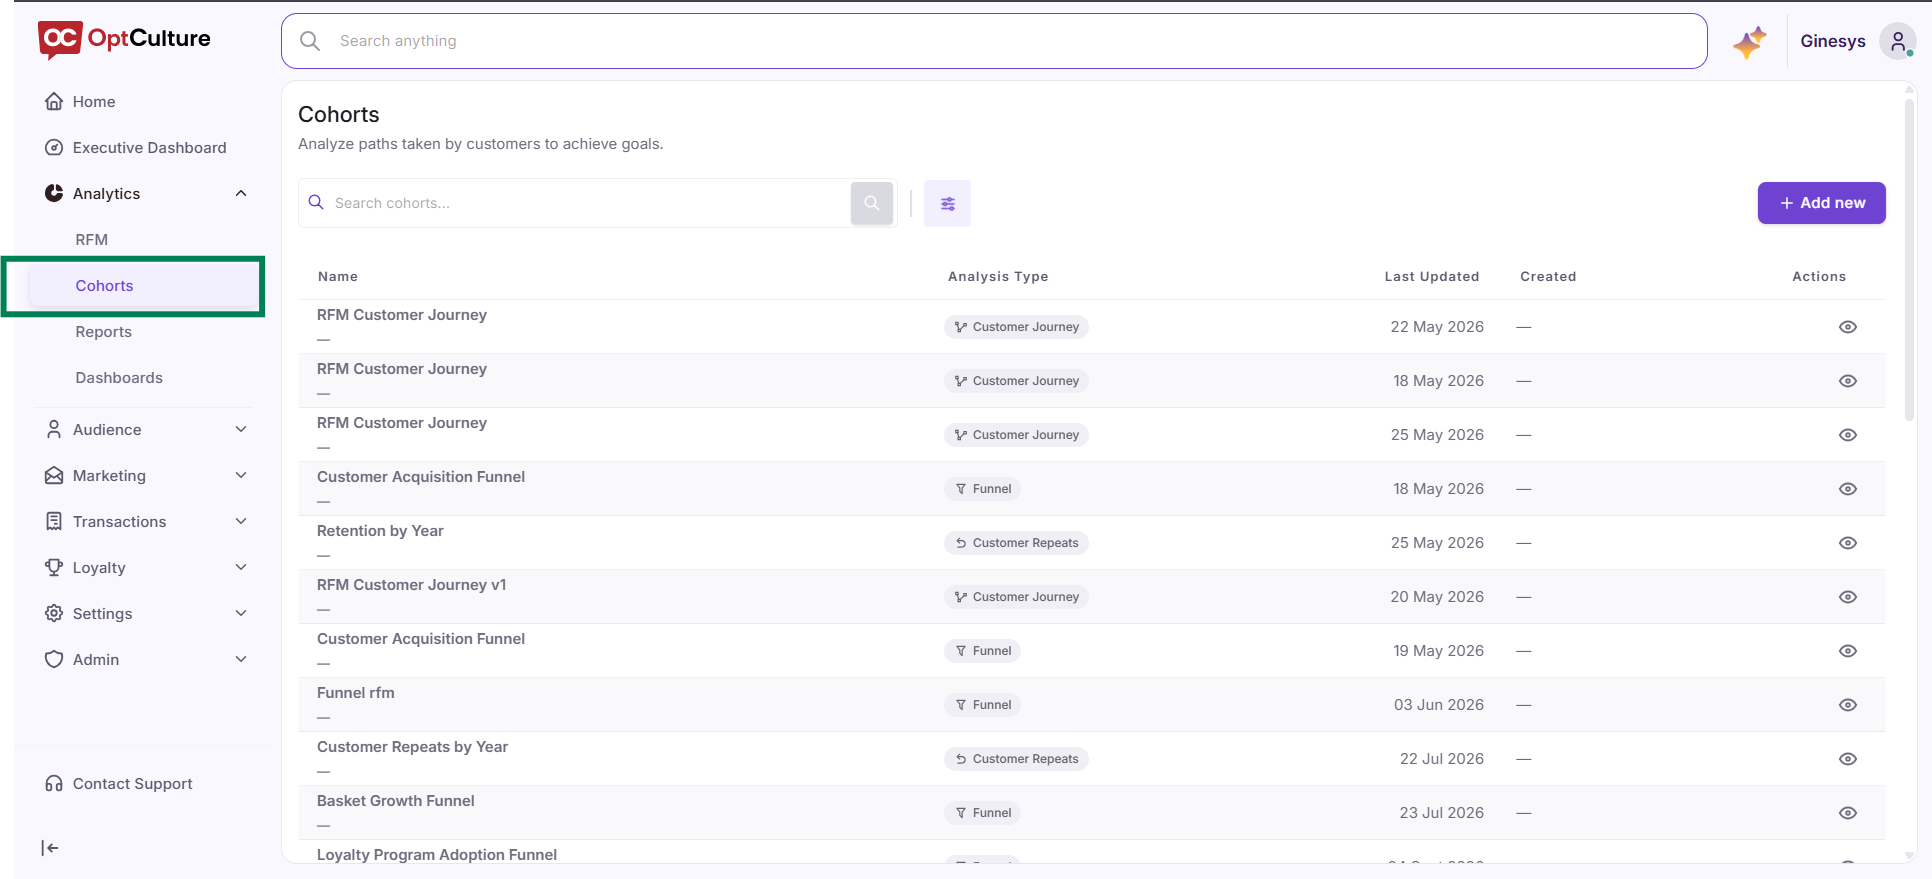
Click the Home / Dashboard icon or navigate to the Analytics menu on the left sidebar.
Step 2: Defining and Customizing Views via Dashboard Builder
-
Click the Edit Dashboard icon (pencil symbol) at the top-right corner.
-
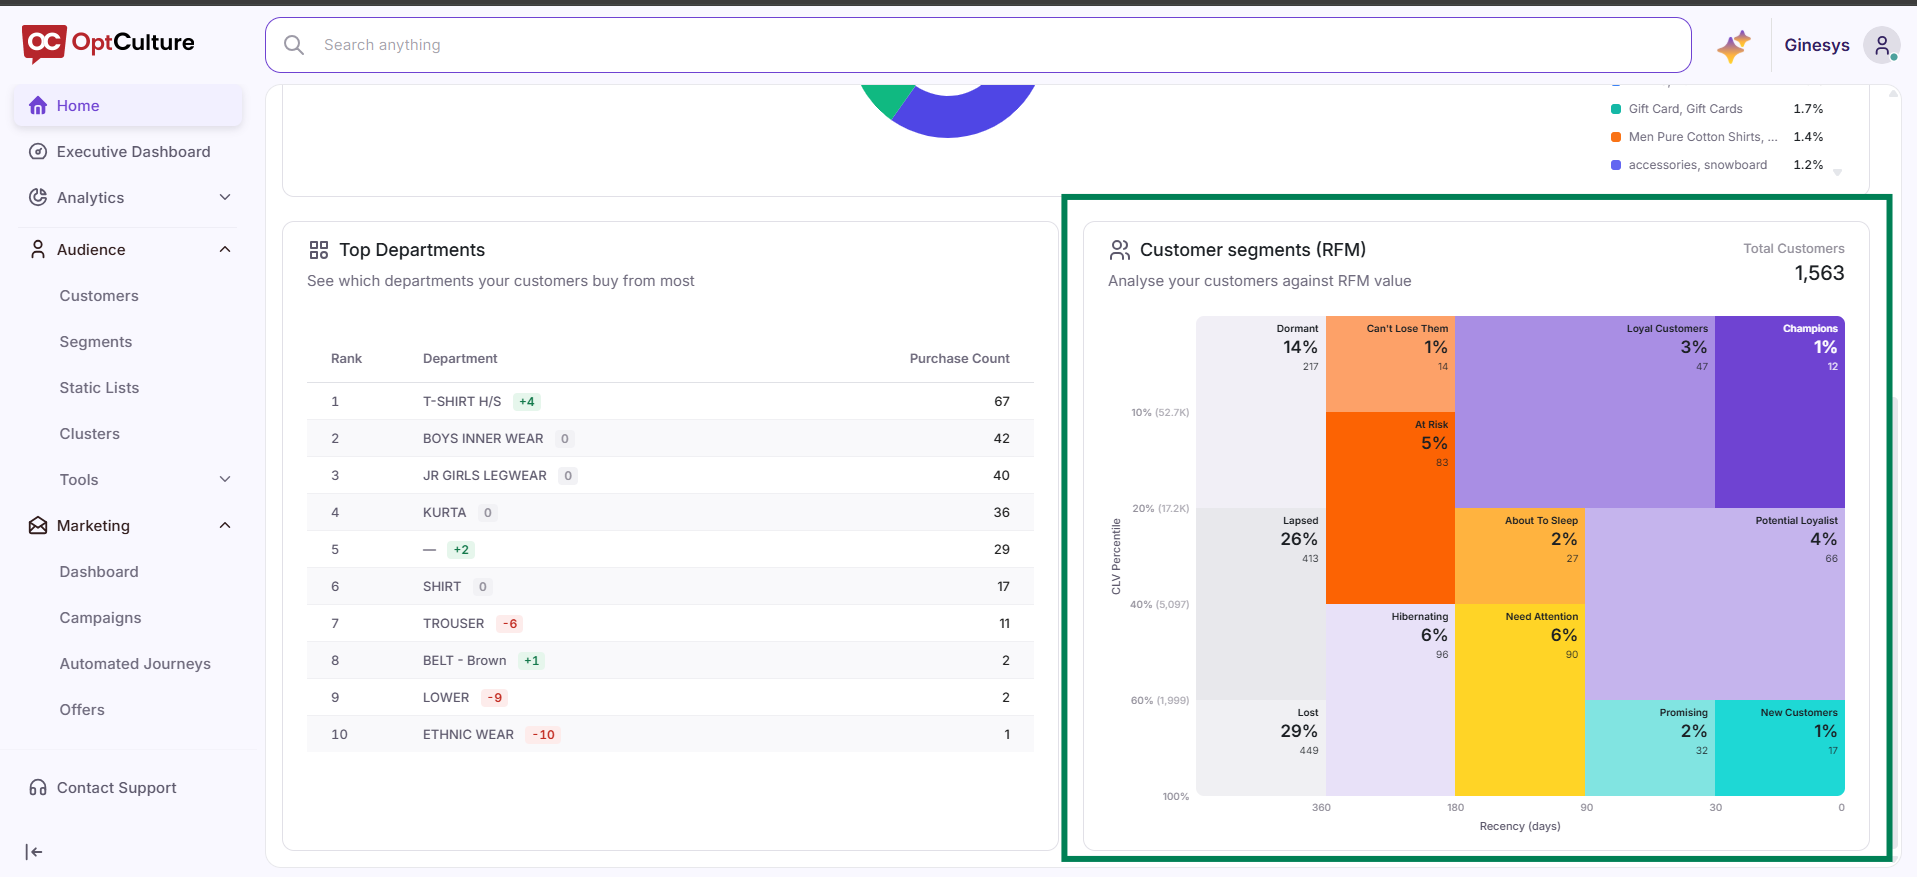
Organize your view to prioritize cohort metrics, including RFM Customer Segments and Top Departments.
-
Save your custom layout to preserve your analytics dashboard configuration.

Step 3: Evaluating Cohort Purchasing Trends Across Departments
-
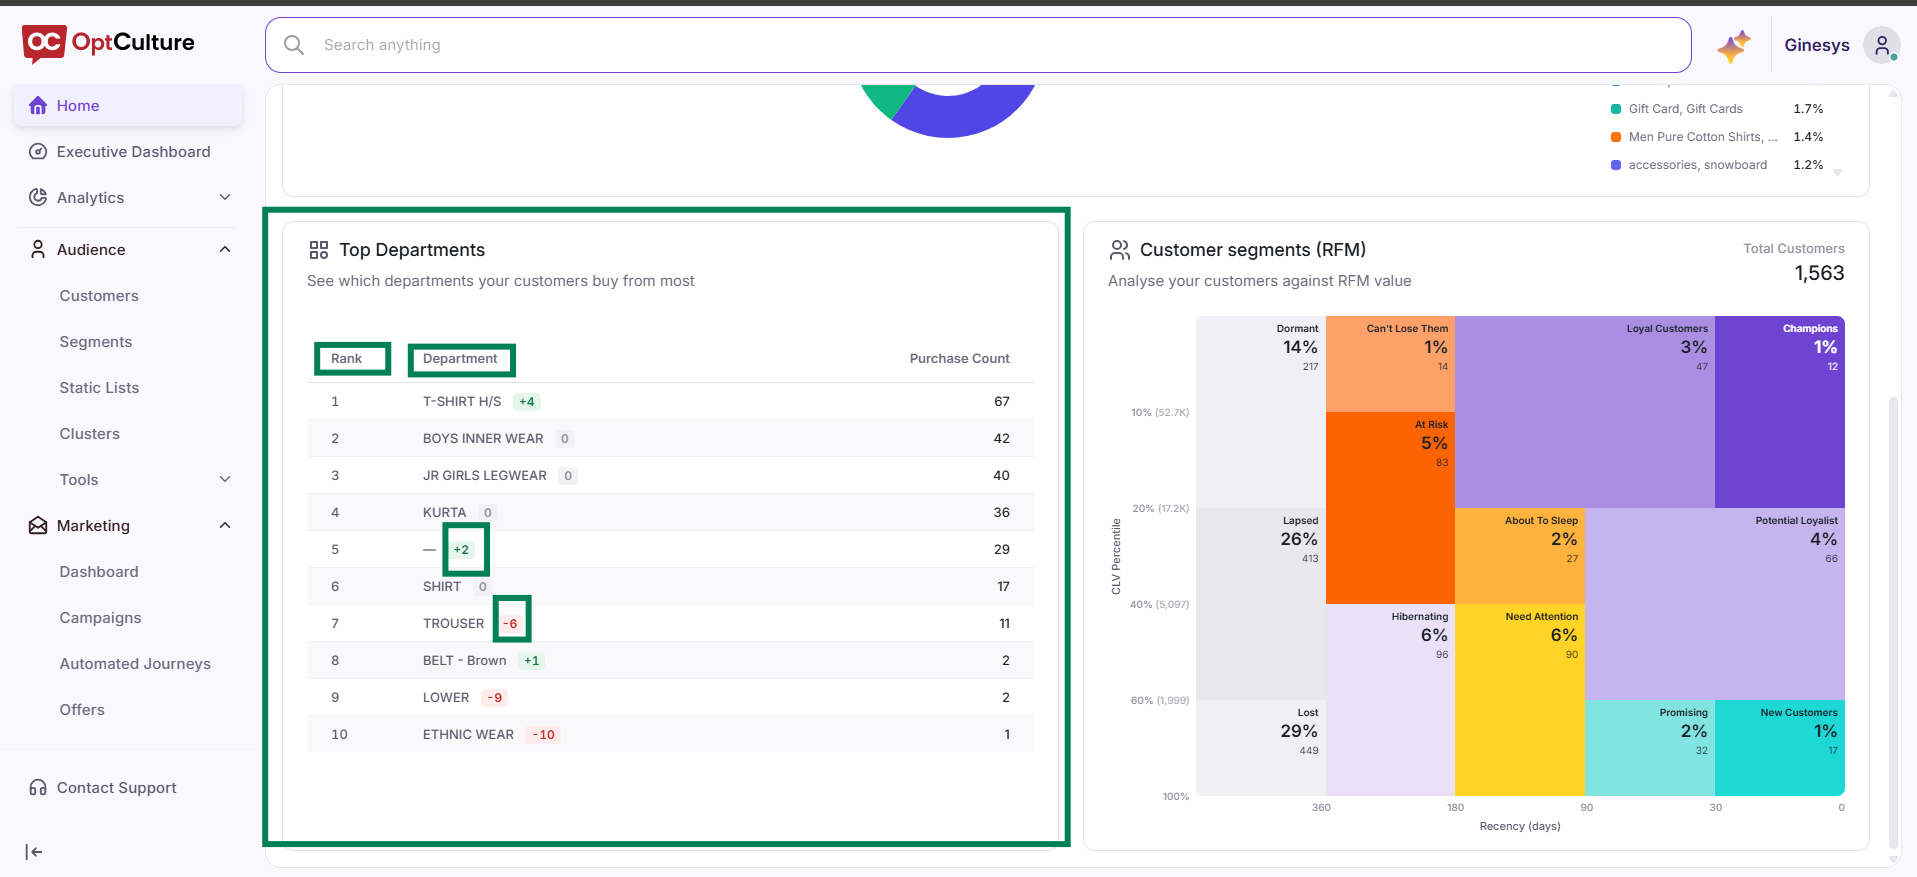
Locate the Top Departments widget.
-
Analyze purchasing volume by category to identify which product departments drive repeat behavior within specific acquisition windows.
-
Observe rank movement tags (e.g., green
+2or red-1) to monitor shifting product preferences over 30-day reporting windows.
Step 4: Tracking Cohort Progression in RFM Segments
-
Go to the Customer Segments (RFM) treemap view.
-
Review customer volume distribution across groups such as Champions, At Risk, and Need Attention.
- Click or hover on a segment block to analyze cohort member counts and determine which groups require immediate re-engagement campaigns.