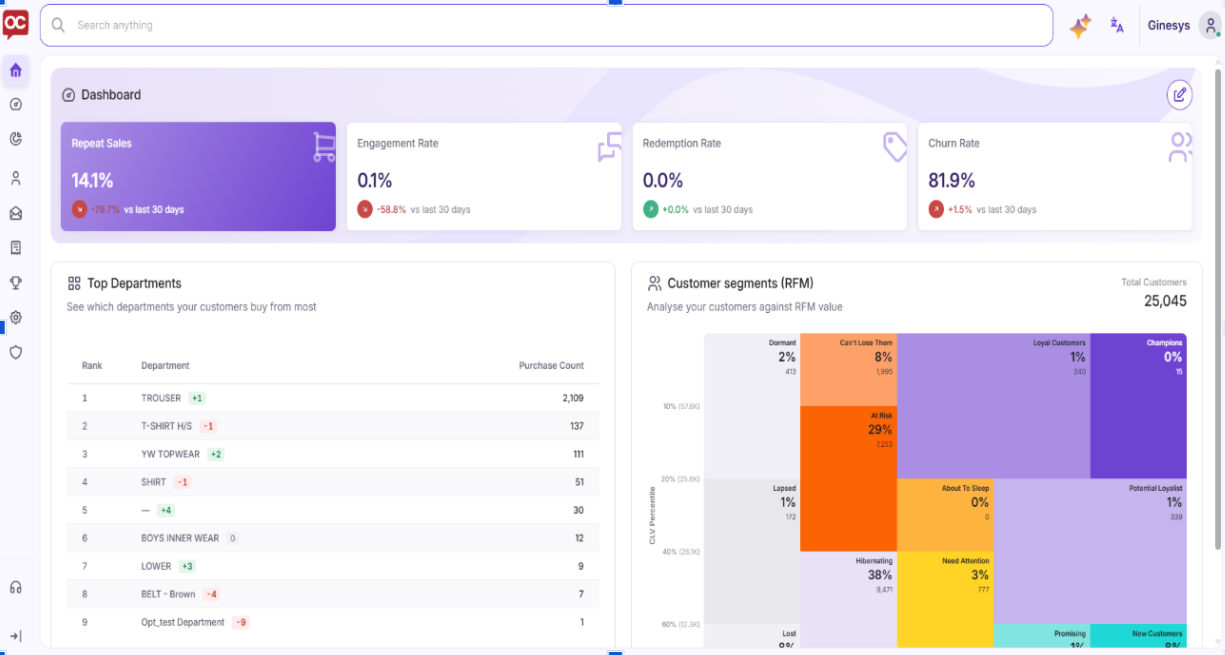
Dashboard Components & Architecture
1. Key Performance Indicator (KPI) Banner
The top of the dashboard displays account-level performance indicators with comparison metrics against previous cycles:
-
Repeat Sales: Measures the percentage and relative trajectory of repeat purchases.
-
Engagement Rate: Measures customer interactions across dynamic marketing channels.
-
Redemption Rate: Tracks promotional usage across active coupons and loyalty incentives.
-
Churn Rate: Monitors customer attrition risk levels to help mitigate customer loss.
2. Top Departments Analytics
The Top Departments widget evaluates product category velocity:
-
Ranks top-performing categories based on net customer purchase volume.
-
Uses directional rank-change indicators (e.g.,
+1,-1,0) to show shift trends relative to previous time periods.
3. Customer Segments (RFM Analysis)
The Customer Segments (RFM) treemap plots customer datasets by Recency, Frequency, and Monetary value:
-
Lifecycle Mapping: Groupings include Champions, Loyal Customers, At Risk, Need Attention, and Dormant.
-
Volume Metrics: Displays active account population totals and percentage share per segment block.
4. System Capabilities
-
Dynamic Customization Engine: Employs the underlying Dashboard Builder to reconfigure widgets, modify views, and adjust layout structure.
-
Multi-Device Responsiveness: Adapts across desktop, tablet, and mobile displays.
-
Performance Caching: Utilizes local data caching to enable faster load times upon navigating back to the Home Screen.
-
Global Localization: Includes complete support for localized formats, including Right-to-Left (RTL) rendering for languages such as Arabic.