Creating a Custom Report
Step 1: Navigate to the Reports Dashboard
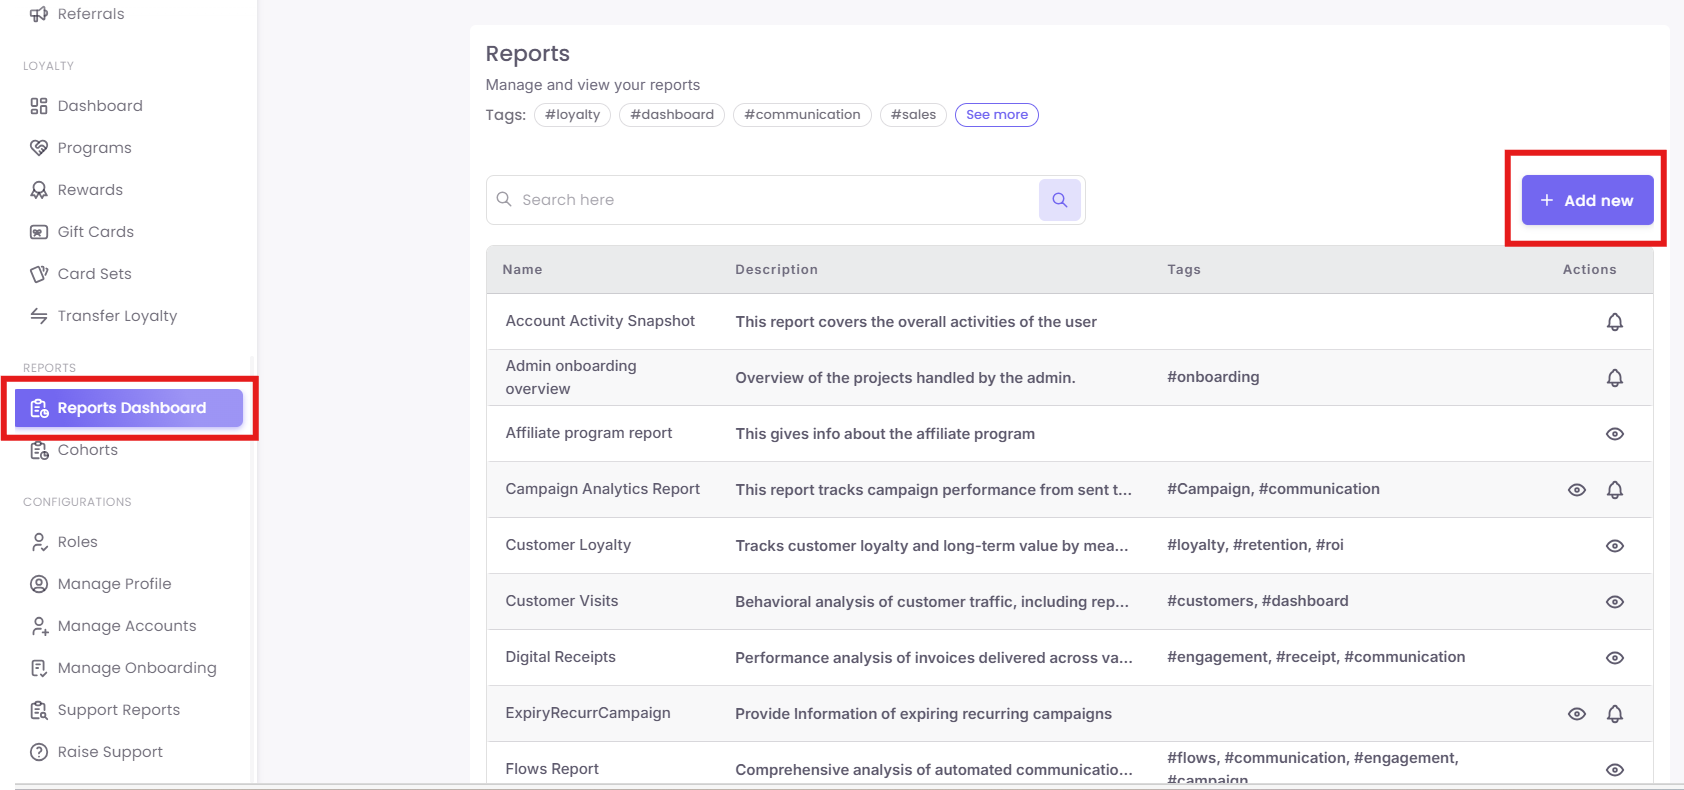
To begin, log into your platform portal. Locate the navigation sidebar on the left side of your screen. Scroll down to the Reports section and click on Reports Dashboard. Once the main dashboard page loads, locate and click the purple + Add new button in the top-right corner.
Step 2: Choosing Your Creation Method
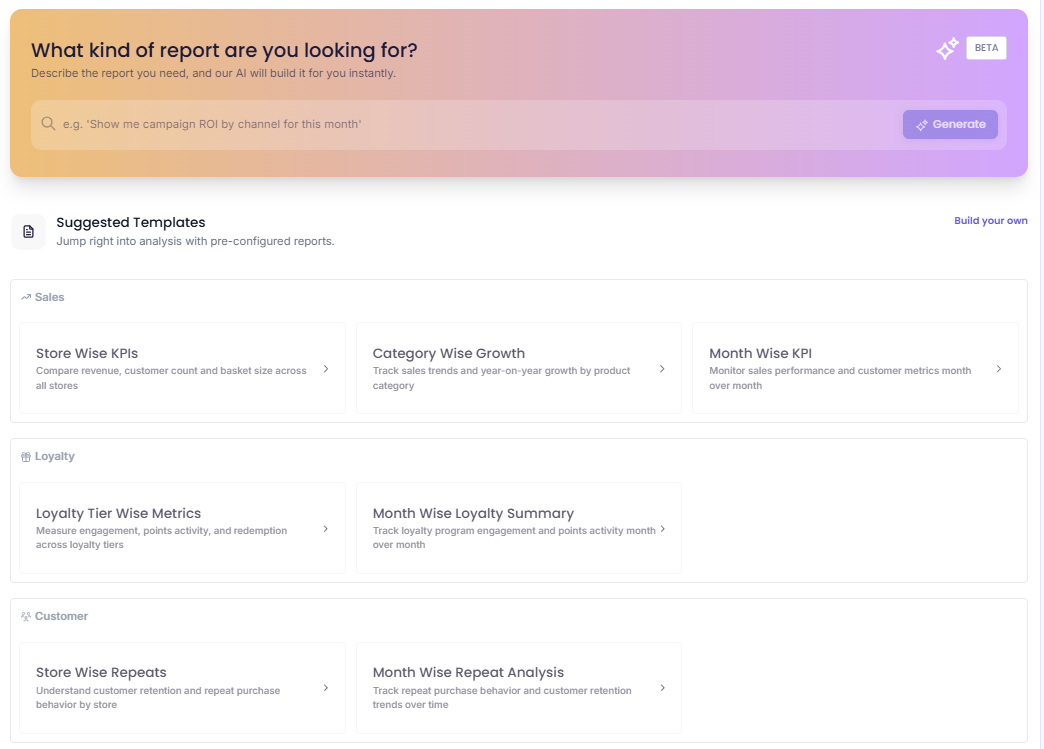
After clicking + Add new, you will land on the primary prompt interface. Here, you have three options to generate a report:
- AI Natural Language Bar: Type a description of your target metrics into the search field and click Generate.
-
Suggested Templates:
ClickThisonsectionanyallowsofyoutheto "Jump right into analysis with pre-configuredmodulesreports." These templates are neatly categorized bydepartment,businesssuchfunction:as -
Sales:
-
Store Wise
KPIsKPIs: Compare revenue, customer count, and basket size across all stores. -
Category Wise Growth: Track sales trends and year-on-year growth by product category.
-
Month Wise KPI: Monitor sales performance and customer metrics month over month.
-
-
Loyalty:
under-
orLoyalty Tier Wise
Metrics:MetricsunderMeasureLoyalty.engagement, points activity, and redemption across loyalty tiers. -
Month Wise Loyalty Summary: Track loyalty program engagement and points activity month over month.
Sales, -
-
Customer:
-
Store Wise Repeats: Understand customer retention and repeat purchase behavior by store.
-
Month Wise Repeat Analysis: Track repeat purchase behavior and customer retention trends over time.
-
-
Build From Scratch:
ClickIftheyouBuild your owntext link on the right sideprefer to construct a completely customlayout.layout, click the Build your own text link located on the far-right side, directly across from the "Suggested Templates" header.
Step 3: Setting Layout Rows and Groupings
If you choose to build from scratch or customize a template, you will enter the step-by-step configuration wizard.
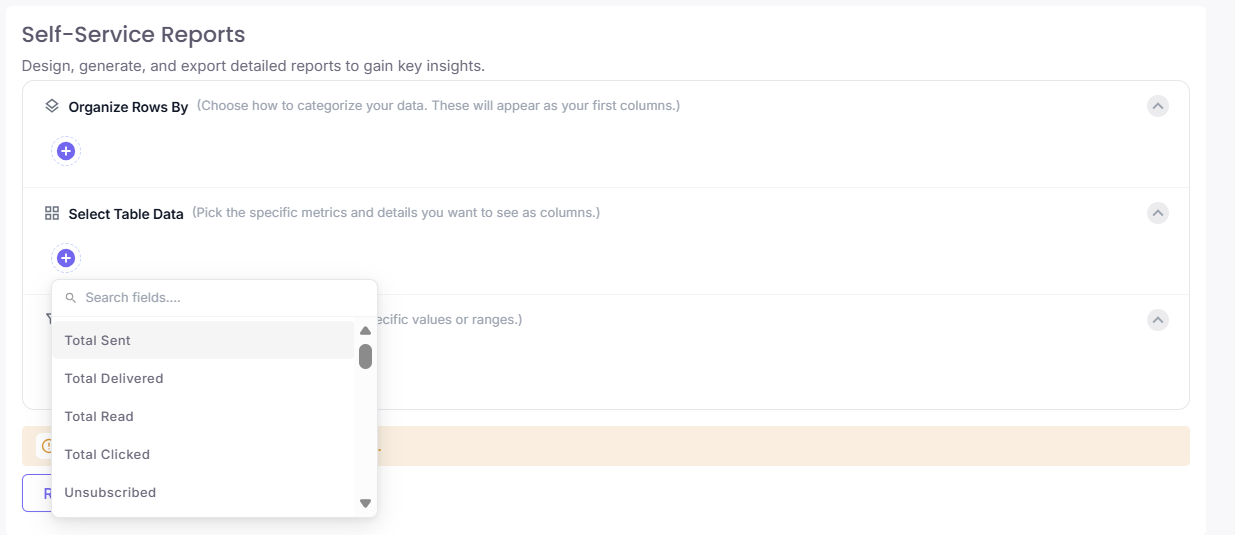
First, define how you want your table rows categorized by interacting with the Organize Rows By section. Click the purple (+) icon to open a searchable drop-down field containing available attributes like Campaign Name, Campaign Type, Channel Type, or Schedule Date. The attributes you select here will become the primary grouping columns of your report.
Step 4: Map Table Metrics & Apply Filters
Continue down the page to build out the rest of your report parameters:
Organize Rows by:Select Table Data: (Pick the specific metrics and details you want to see as columns.) Click the purple (+) icon in this section to select your
columns.columns. These are the quantitative metrics you want to evaluate against yourrows—suchrows.asA "Search fields...." drop-down will appear, allowing you to select communication metrics (like Total Sent, Total Delivered, Total Read, Total Clicked, orRevenueUnsubscribed) or sales metrics (like Total Sales Tax Incl. or Total Customers).Filter
By:by: (Filter your report by adding rules for specific values or ranges.) Refine your dataset by adding specific conditionalboundaries.boundaries. For example, click the purple (+) icon to add a time boundary rule likeSales Date$\rightarrow$this yearto isolate a specifictimeframe.
Step 5: Preview, Save, and Export
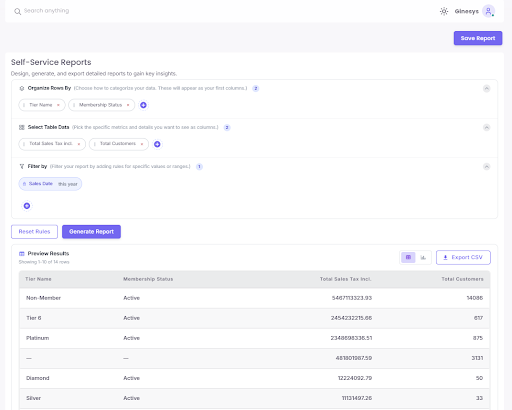
Once your configurations are set, click the purple Generate Report button. The interface will dynamically execute a live query and populate a Preview Results table below your rules.
Review the structured entries to verify your configuration is correct. When satisfied with the output:
-
Click Save Report in the top-right corner to store this layout for future use.
-
Click Export CSV right above the table frame to instantly download the raw data asset to your local drive