Accessing and Understanding the Report
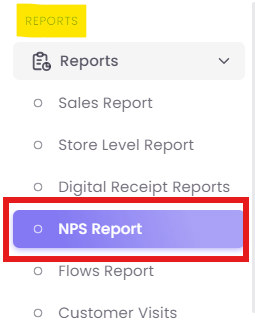
Step 1: Navigate to the Report
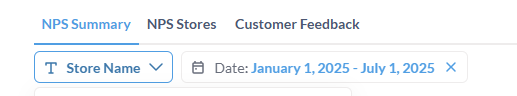
Step 2: Apply Filters
At the top of the report, you can filter your data by Date Range, Store, and other criteria to focus your analysis.
Understanding the Report Tabs
The report is organized into three distinct tabs, moving from a high-level overview to granular, individual feedback.
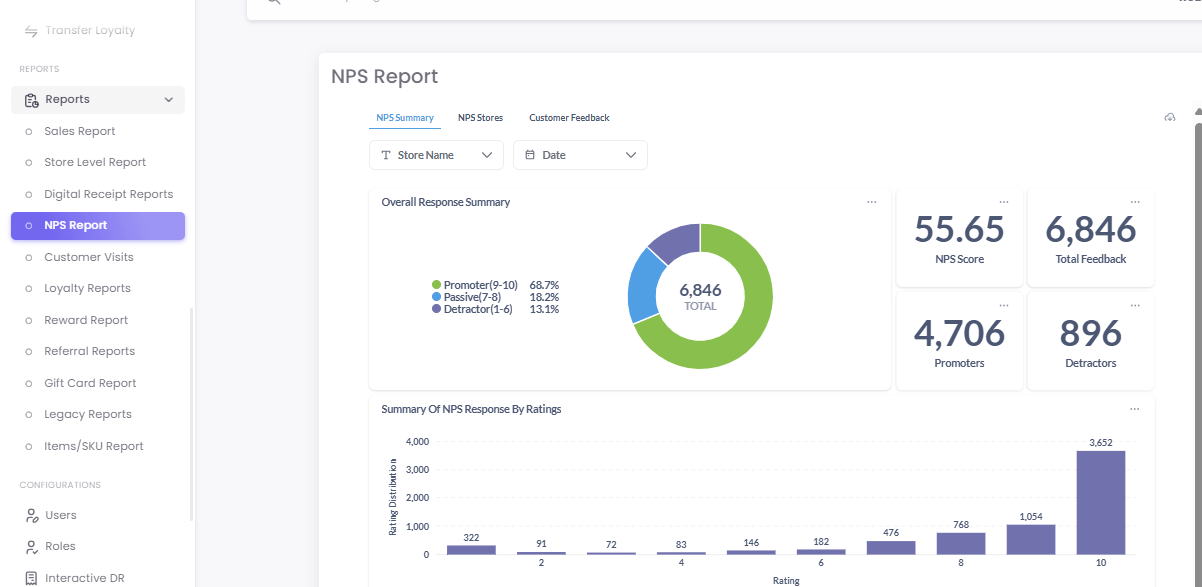
A. NPS Summary Tab
This tab provides an overall snapshot of your brand's customer sentiment. It shows you the "what."
-
Key Metrics: At a glance, you can see your Overall NPS Score (e.g., 55.65), the Total Feedback received (e.g., 6,846), and the total number of Promoters (e.g., 4,706) and Detractors (e.g., 896).
-
Sentiment Breakdown: A donut chart visualizes the percentage breakdown of your customers into Promoters (e.g., 68.7%), Passives (e.g., 18.2%), and Detractors (e.g., 13.1%).
-
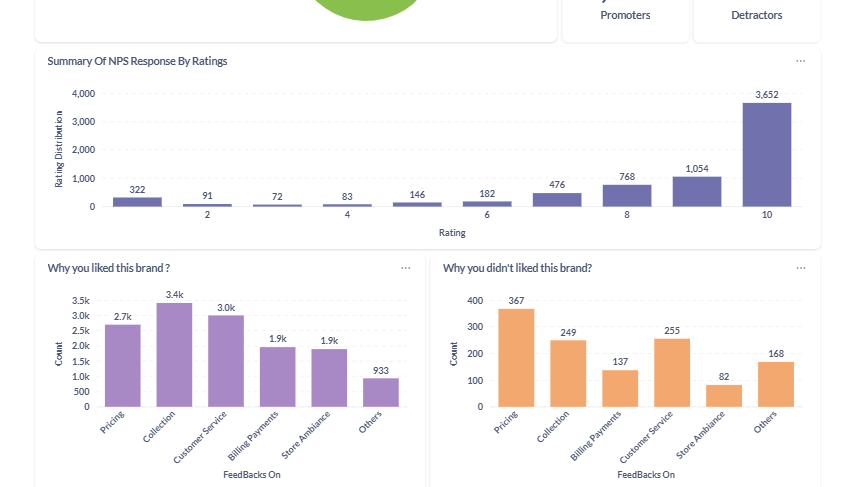
Rating Distribution: A bar chart shows the raw count of responses for each rating from 1 to 10, helping you see the exact distribution of scores.
- Feedback Drivers: Two powerful bar charts show you why customers gave the ratings they did, based on the follow-up questions in your survey (e.g., "Why you liked this brand?" or "What can we improve?").
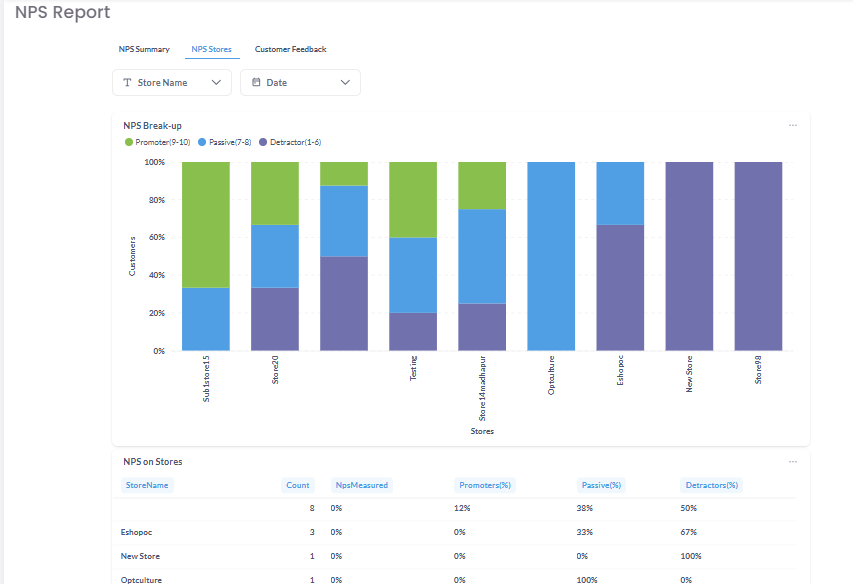
B. NPS Stores Tab
This tab allows you to compare NPS performance across different store locations. This helps you identify "where" you have strengths and weaknesses.
-
NPS Break-up Chart: This chart provides a powerful visual comparison (often a stacked bar chart) of the Promoter, Passive, and Detractor percentages for each store, side-by-side.
-
NPS on Stores Table: This table provides the raw data for each store, including the total Count of feedback, the specific percentages for each category, and the final NPS score for that location.
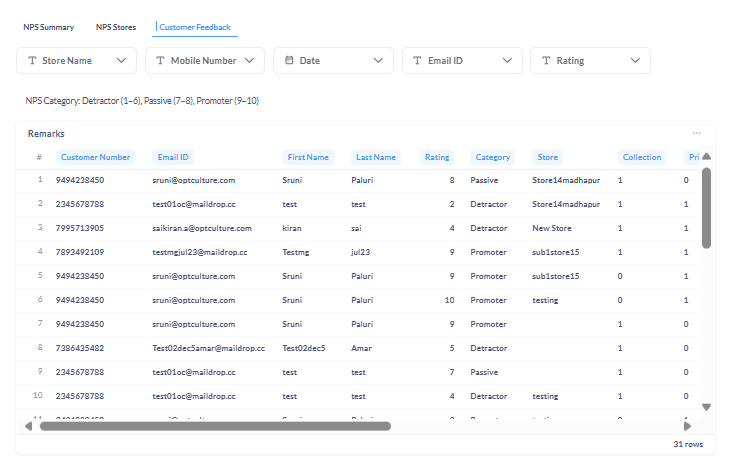
C. Customer Feedback Tab
This tab is where you find the qualitative insights—the "why" behind the scores. It allows you to read the verbatim comments from individual customers.
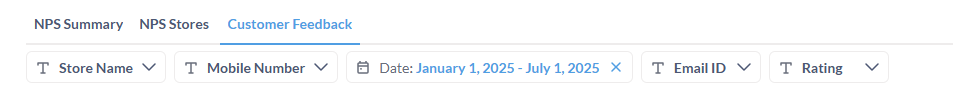
- Advanced Filtering: You can filter the data by Store Name, Mobile Number, Date, Email ID, and Rating (e.g., "show me all Detractors who gave a score of 3").
-
Feedback Table: This table provides the raw data of NPS feedback, including the customer's details (if available), the store they visited, their rating, and their specific comments.