Step-by-Step Guide: Configuring & Using Dashboards
-
Sign in to your OptCulture workspace.
-
Select the Home / Dashboard menu icon from the left primary navigation bar.
-
Review the top aggregate metric cards (e.g., Repeat Sales: 14.1%) to analyze recent business health trends.
Step 2: Editing the Dashboard Layout
-
Click the Edit Dashboard button (pencil icon) located at the top-right corner of the dashboard area.
-
Move Widgets: Click and hold a widget's drag header to move it to a different area of the layout grid.
-
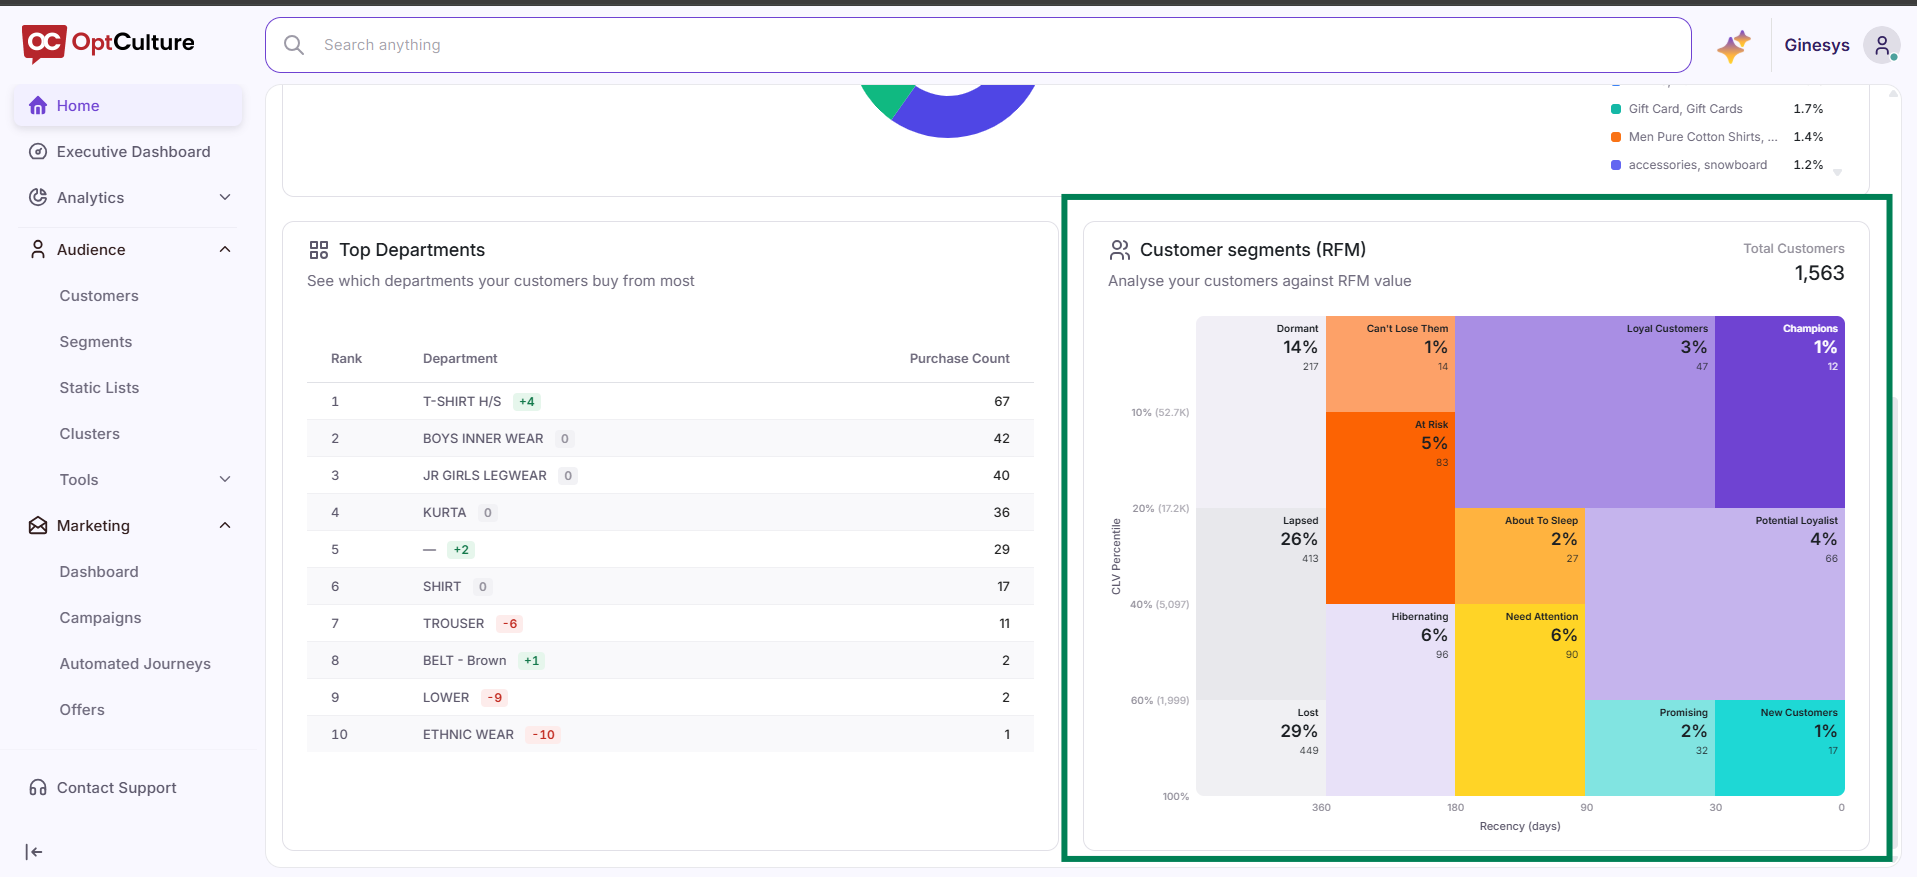
Toggle Visibility: Add or remove active data components (such as Onboarding Progress Tracker, Top Departments, or RFM Segments) using the widget management menu.
-
Click Save Layout to apply your changes to your session.

Step 3: Monitoring Department Metrics
-
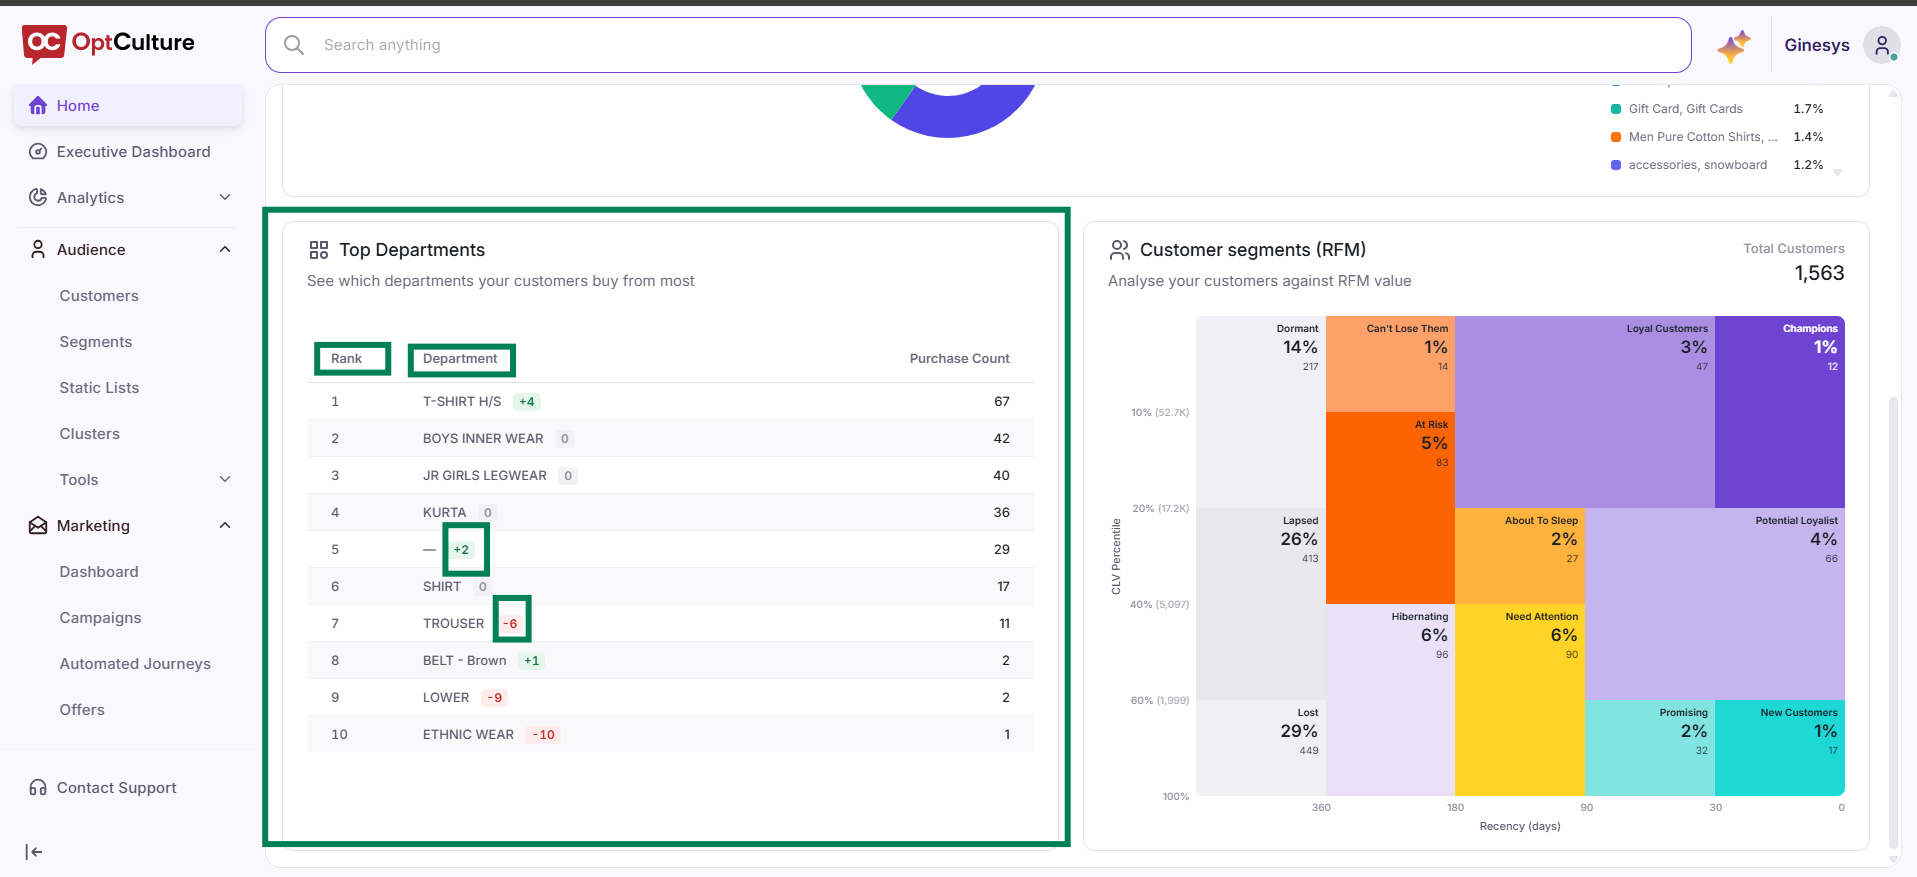
Scroll to the Top Departments module.
-
Inspect the Rank and Department columns to see top product categories.
-
View the indicator tags adjacent to department titles (e.g., green
+2or red-1) to track shifts in customer purchasing behavior.
Step 4: Analyzing RFM Segments