Part 2: Understanding the C360 Dashboard
The C360 View is organized into several key sections to give you a complete picture of the customer at a glance.
-
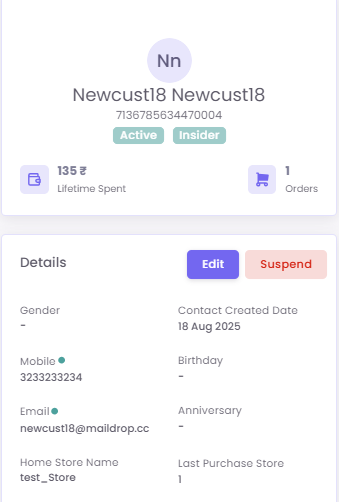
A. Profile Summary:
Provides the Customer Information. You can also see their total Lifetime Spent and number of Orders.
-
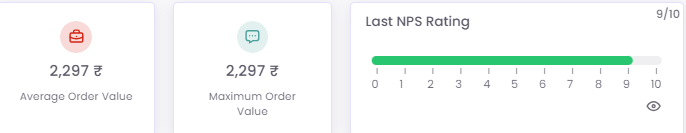
B. Key Metrics:
This section provides quick insights into spending habits and Last NPS Rating, if available.
-
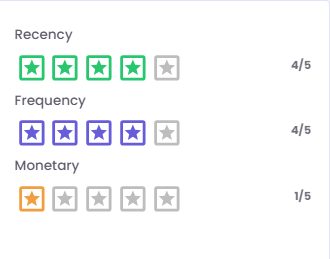
C. RFM Analysis:
This panel rates the customer on a 5-star scale for Recency (how recently they visited), Frequency (how often they visit), and Monetary (how much they spend), providing a quick assessment of their engagement level.
-
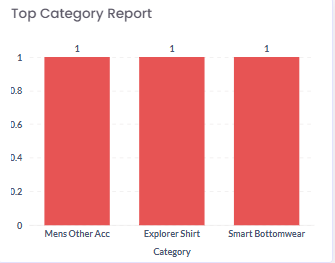
D. Top Category Report:
This chart visualizes the product categories the customer purchases from most often, offering valuable insight into their preferences.