
Accessing and Usage of Report
Step1: Navigate to the Report
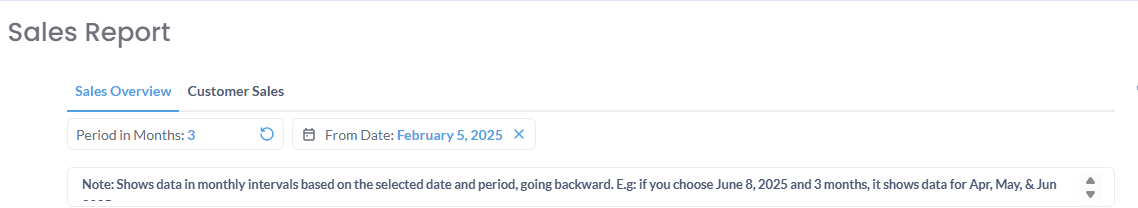
Step2: Understanding the "Sales Overview" Tab (The "Macro" View)
This tab is your high-level dashboard. It shows you the what—your key performance metrics and how they compare to the previous period.
How to Filter the View
At the top of the report, you can set your time frame:
-
Period in Months: The number of months you want to analyze (e.g.,
1). -
From Date: The end date for your report. The system will look backward from this date based on the period you selected.
-
Note: As the helper text indicates, if you choose June 8, 2025, and a 3-month period, the report will show data for April, May, and June.
-
Reading the Key Performance Indicators (KPIs)
The dashboard is divided into four main widgets that show your performance for the selected period (e.g., Feb 2025) and compare it to the prior period (e.g., Jan 2025).
-
Number of Purchases: The total count of all transactions.
-
Revenue: The total monetary value of all sales in that period.
-
Repeat Customers: The number of unique existing customers who made at least one purchase.
-
New Customers: The number of unique customers who made their first-ever purchase in this period.