
Accessing and Usage of Report
Step1: Navigate to the Report
-
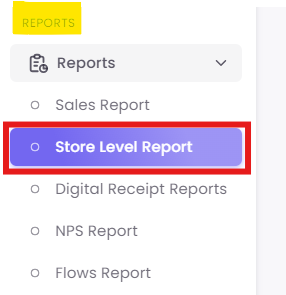
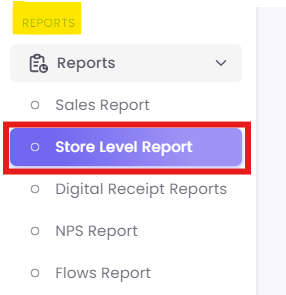
From the main menu, click on Reports.
-
Select Store Level Report from the sub-menu.
Step 2: Set Global Filters
Before analyzing any data, you must select the store and time frame you wish to investigate. These "global" filters are located at the top of the report and apply to all tabs.
-
A. Store: Select the specific store location you wish to analyze from the dropdown menu.
-
B. Date: Choose the time period for your analysis. You can select predefined ranges (like "Previous 30 days or today") or set a custom date range.
Step 3: Analyze Customer Sentiment (NPS Rating Tab)
The default tab, NPS Rating, provides a complete breakdown of customer feedback and your Net Promoter Score (NPS) for the selected store.
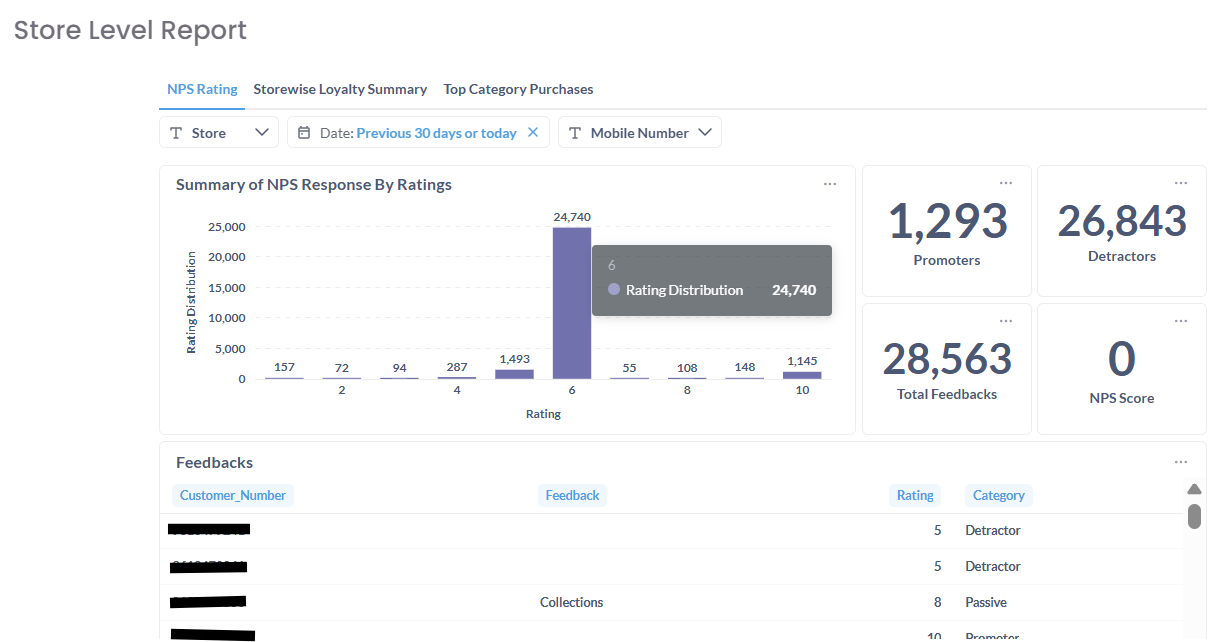
Caption: The NPS Rating tab, showing KPIs, response distribution, and a feedback log.
This screen is broken into several key components:
A. Summary of NPS Response By Ratings: This bar chart gives you a quick visual summary of all ratings received (from 0 to 10), helping you instantly identify the most common scores.
B. NPS KPIs: These are the high-level summary cards for the selected period:
- Promoters: Total customers who scored 9 or 10.
- Detractors: Total customers who scored 0-6.
- Total Feedbacks: The sum of all responses.
- NPS Score: The final calculated score $(\% \text{ Promoters} - \% \text{ Detractors})$.
C. Feedbacks Table: This log shows the line-by-line feedback from customers.
- Customer_Number: The unique identifier for the customer.
- Feedback: The verbatim comment left by the customer. This is crucial for understanding why they gave their score.
- Rating: The 0-10 score.
- Category: The customer's classification (Promoter, Passive, Detractor).
D. Tab-Specific Filter: This tab also includes a Mobile Number filter, allowing you to search for the feedback history of a specific customer.
Step 4: Evaluate Loyalty Program Health (Store wise Loyalty Summary Tab)
Click the Storewise Loyalty Summary tab to analyze the performance of your loyalty program at this specific store. This view shows member activity, transactions, and points velocity.
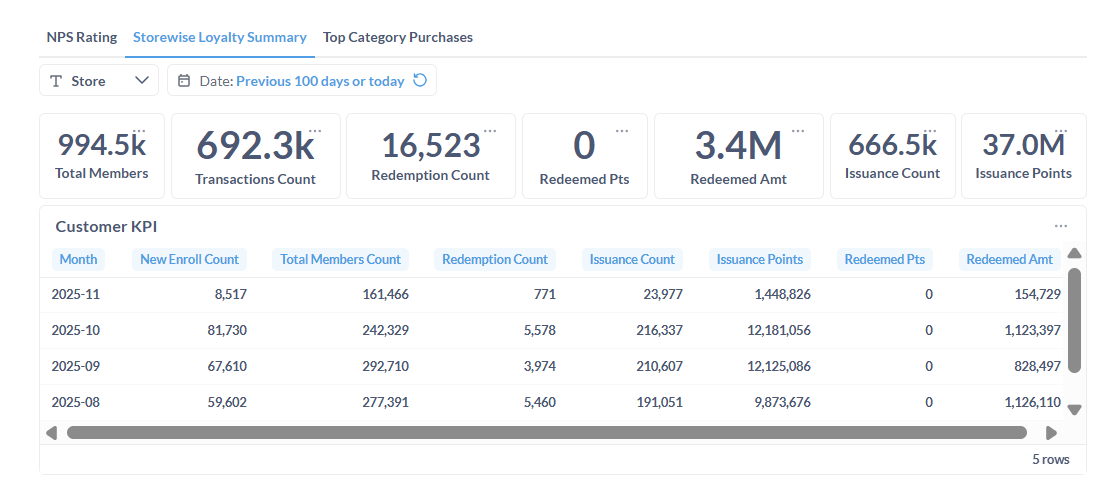
Caption: The Storewise Loyalty Summary tab, showing overall KPIs and a monthly trend table.
A. Overall KPIs: This top banner summarizes all loyalty activity for the selected date range, including:
- Total Members: Total loyalty members associated with that store.
- Transactions Count: Total number of loyalty-affiliated transactions.
- Redemption Count / Amt: Total number of redemptions and their monetary value.
- Issuance Count / Points: Total number of times points were issued and the total points given.
B. Customer KPI Table: This table breaks down the key metrics month-by-month, making it easy to spot trends.
- New Enroll Count: See how many new members are signing up each month.
- Redemption Count: Track if redemption activity is increasing or decreasing over time.
- Issuance Points: Monitor how many points are being distributed monthly.
Step 5: Identify Top Selling Products (Top Category Purchases Tab)
Click the Top Category Purchases tab to see what your customers are buying at this store. This report ranks your product categories by sales volume.
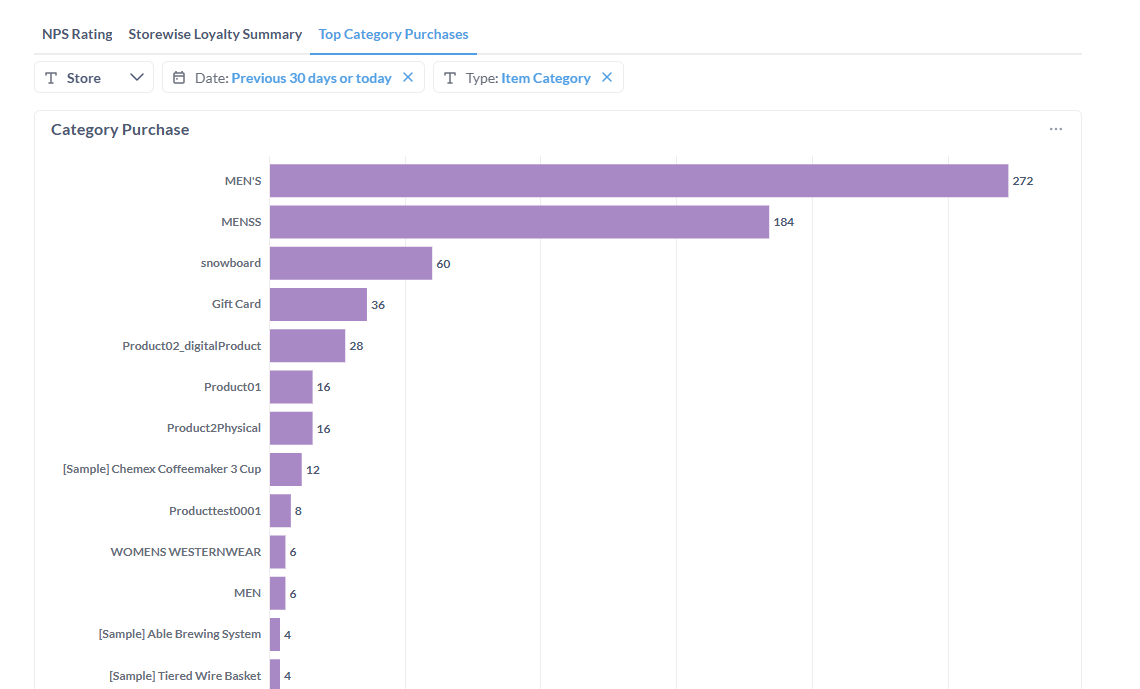
Caption: The Top Category Purchases tab, ranking product categories by purchase count.
A. Category Purchase Chart: This horizontal bar chart clearly visualizes your top-performing categories. The length of the bar and the number at the end represent the total purchase count for that category.
B. Tab-Specific Filter: Use the Type filter on this tab to change how your products are grouped (e.g., by "Item Category," "Brand," or "SKU").